
Why this matters
Most options strategy names describe a shape, not an edge. "Iron condor" tells you how four contracts are arranged relative to each other; it says nothing about whether that arrangement makes money for you, in your market, at your costs. Traders who skip the mechanics and go straight to "sell premium, stay defined-risk" tend to discover the structure's actual behavior — concentrated gamma risk near expiration, vega exposure that doesn't show up until IV moves, execution costs that eat a thin credit — only after it costs them.
This article builds the iron condor from its parts: two vertical spreads, four legs, one expiration. It derives the payoff and the Greeks directly rather than asserting them, includes a tested Python implementation, and spends as much time on where the structure fails as on how it works. There is no backtest here and no performance claim — what follows is structural analysis, and structure is the part you can actually verify before you risk anything on top of it.
What an iron condor actually is
An iron condor is two credit spreads on the same underlying and the same expiration, opened at the same time:
- A bull put spread: sell a put, buy a further out-of-the-money put (lower strike).
- A bear call spread: sell a call, buy a further out-of-the-money call (higher strike).
Combined, that's four legs, ordered by strike from low to high:
- Long put (lowest strike) — protection.
- Short put — sold, collects premium.
- Short call — sold, collects premium.
- Long call (highest strike) — protection.
You collect a net credit for opening the position, because the two options you sell (closer to the money) are worth more than the two you buy (further away). The position profits if the underlying stays between the two short strikes through expiration, and the wings — the long put and long call — exist purely to cap how much you can lose if it doesn't.
That last point is the one worth sitting with: an iron condor is a short strangle with the tail risk bought off. You give up part of the credit you'd collect from a naked short strangle in exchange for a hard ceiling on the loss. It is not a separate, safer strategy in kind — it's the same short-volatility bet with insurance attached, and the insurance is priced into the reduced credit.
The payoff at expiration
Everything about an iron condor's expiration payoff is fixed the moment you open it, given the strikes and the credit received. Using a synthetic example — illustrative strikes and a round starting spot price, not a market quote — with the underlying at 100:
| Leg | Strike |
|---|---|
| Long put | 90 |
| Short put | 95 |
| Short call | 105 |
| Long call | 110 |
Net credit received: $1.02 per share ($102 per contract, 100-share multiplier) — this is not a rounded, hand-picked number. It's the Black-Scholes fair value of the two spreads at these strikes with the underlying at 100, 30 days to expiration, and 20% annualized volatility (the same model used for the Greeks later in this article, so the two sections agree with each other).
From the strikes and credit alone:
- Max profit = net credit = $1.02/share, realized anywhere the underlying finishes between 95 and 105.
- Max loss = (spread width − net credit) = (5 − 1.02) = $3.98/share, realized at or beyond either long strike (90 or 110).
- Lower breakeven = short put strike − net credit = 95 − 1.02 = 93.98.
- Upper breakeven = short call strike + net credit = 105 + 1.02 = 106.02.
The risk/reward here is worth stating plainly: this position risks about $3.98 to make $1.02 — roughly 3.9:1 against you in raw dollar terms. That is not a mispriced or unusually bad example; it's a direct consequence of selling strikes this close to the money. Moving the short strikes further from spot doesn't fix the ratio — it makes it worse, because credit shrinks faster than the width does. Holding the wing width fixed at 5 and moving both short strikes symmetrically away from the current price, the same pricing model gives:
| Short strikes | Credit | Max loss | Loss : profit |
|---|---|---|---|
| 98 / 102 | 2.23 | 2.77 | 1.24 : 1 |
| 97 / 103 | 1.76 | 3.24 | 1.84 : 1 |
| 95 / 105 (this example) | 1.02 | 3.98 | 3.90 : 1 |
| 93 / 107 | 0.54 | 4.46 | 8.29 : 1 |
| 90 / 110 | 0.17 | 4.83 | 27.98 : 1 |
Wider short strikes raise the probability of finishing inside the profit zone — but they do it by collecting less and less credit relative to the fixed wing width, which makes the raw risk/reward ratio worse, not better. Narrower short strikes do the opposite: more credit relative to width, a better raw ratio, but a smaller range where you're actually profitable. There's no configuration that gives you a high probability of profit and a favorable risk/reward at the same time — the two move in opposite directions together, because both come from the same priced distribution.
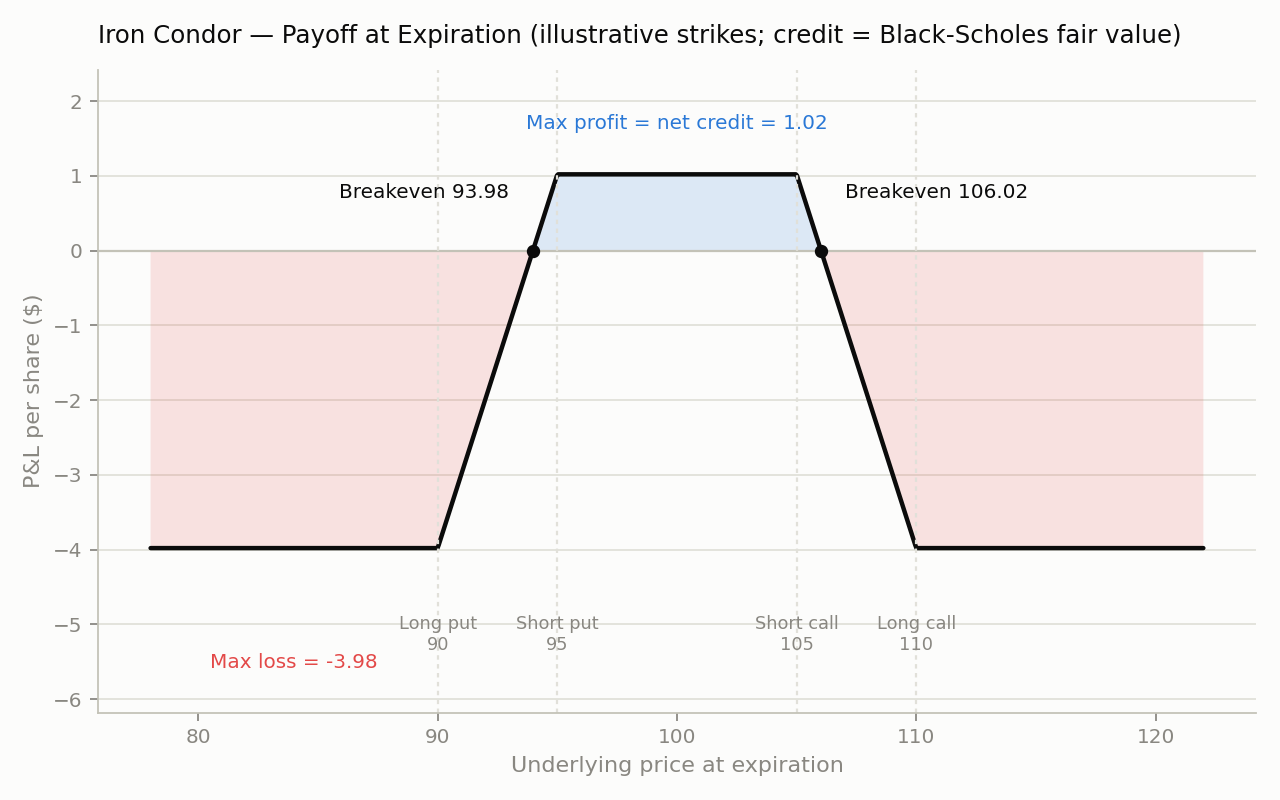 Iron condor payoff at expiration — flat profit region between the short strikes, sloped losses through both breakevens, flat capped loss beyond the long strikes.
Between 93.98 and 106.02, the position doesn't just avoid losing — the profit is flat at $1.02 regardless of where exactly the underlying lands. That flatness is easy to misread as safety. It's better read as: this trade has one outcome (max profit) over a wide middle range, a second outcome (a loss that grows linearly) over two narrow bands, and a third outcome (max loss, also flat) over everything beyond that — and on this example's own numbers, two of those three outcomes lose more than the third one makes.
The Greeks: what "short gamma, short vega, long theta" means in practice
The payoff diagram above describes expiration. Almost all of an iron condor's life happens before expiration, and during that time the position is governed by its Greeks — which are not constant.
At initiation, with the underlying near the center of the range (S = 100, 30 days to expiration, 20% annualized volatility, flat vol assumed across strikes), the position's Greeks come out to approximately:
- Delta ≈ −0.007 (per share) — close to flat, because the position is roughly symmetric around the current price.
- Gamma ≈ −0.065 (per share) — negative. As the underlying moves, delta moves against you: a rally makes the position more short, a selloff makes it more long.
- Vega ≈ −$0.11/share per 1-point rise in implied volatility (≈ −$11/contract) — negative. A rise in IV hurts the position even if the underlying doesn't move.
- Theta ≈ +$0.035/share per day (≈ +$3.54/contract/day) — positive. Time decay, on its own, helps the position.
Read together, this is a short-volatility position: it wants low realized movement and falling or flat implied volatility, and it earns time decay for taking that side of the bet. That's the entire economic logic of selling premium, stated in Greek terms instead of slogans.
The part that matters more than the initiation snapshot is that none of these numbers are fixed for the life of the trade. Gamma in particular is not simply "larger near expiration" — it depends on where the underlying sits relative to the short strikes, and that dependence gets sharper as time runs out. Holding volatility and strikes fixed and only changing days-to-expiry, the same position's gamma behaves very differently depending on where the underlying is pinned:
| Days to expiry | Gamma, pinned at short call (105) | Gamma, pinned at center (100) |
|---|---|---|
| 30 | −0.030 | −0.065 |
| 14 | −0.051 | −0.082 |
| 7 | −0.103 | −0.056 |
| 3 | −0.202 | −0.010 |
| 1 | −0.363 | −0.000 |
Near a short strike, gamma grows more than tenfold from 30 days to 1 day out — the position becomes sharply more sensitive to the underlying exactly when there's the least time left to react. Comfortably inside the range, between the short strikes, gamma stays a fraction of that and fades to nearly zero by the final day, because there's very little uncertainty left about that portion finishing safely (it isn't a perfectly smooth decline — it can tick up slightly first — but the end state is unambiguous: negligible gamma at the center, large gamma at the edge). Both things are true at once: the same position can be getting safer in the middle of its range and more dangerous near its edges as expiration approaches. Judging risk from a single Greeks snapshot at entry misses this entirely — it's one reading of a surface that reshapes itself as price moves and time passes, not a fixed property of the trade.
Vega tells a related story. A short iron condor loses money when implied volatility rises, independent of what the underlying does. An event that spikes IV — an earnings surprise, a macro shock, a liquidity event — can produce a mark-to-market loss on a position that hasn't even breached a breakeven yet, purely from the vega line.
Worked implementation (Python)
The payoff and Greeks above aren't asserted — they're computed, including the net credit itself. Below is the actual implementation used to produce every number in this article: Black-Scholes pricing and Greeks for a single leg, a fair-value credit computed from the four leg prices (not assumed), a payoff-at-expiration function, and position Greeks summed leg by leg with position sign (+1 for legs you're long, −1 for legs you're short). This is structural analysis code, not a backtest and not a trading system — it has no data source and no historical prices.
import math


def norm_cdf(x):
    return 0.5 * (1.0 + math.erf(x / math.sqrt(2.0)))


def norm_pdf(x):
    return math.exp(-0.5 * x * x) / math.sqrt(2.0 * math.pi)


def bs_greeks(S, K, T, r, sigma, option_type):
    """Black-Scholes price and Greeks for a single European option leg.
    No dividend yield term (q=0) — see caveats below."""
    if T <= 0 or sigma <= 0:
        raise ValueError("T and sigma must be > 0 — d1/d2 are undefined at the boundary, "
                          "which is exactly where gamma/theta blow up (see below).")
    d1 = (math.log(S / K) + (r + 0.5 * sigma ** 2) * T) / (sigma * math.sqrt(T))
    d2 = d1 - sigma * math.sqrt(T)

    gamma = norm_pdf(d1) / (S * sigma * math.sqrt(T))
    vega = S * norm_pdf(d1) * math.sqrt(T)  # per 1.0 (100-point) vol change

    if option_type == "call":
        price = S * norm_cdf(d1) - K * math.exp(-r * T) * norm_cdf(d2)
        delta = norm_cdf(d1)
        theta = (-(S * norm_pdf(d1) * sigma) / (2 * math.sqrt(T))
                 - r * K * math.exp(-r * T) * norm_cdf(d2))
    else:  # put
        price = K * math.exp(-r * T) * norm_cdf(-d2) - S * norm_cdf(-d1)
        delta = norm_cdf(d1) - 1.0
        theta = (-(S * norm_pdf(d1) * sigma) / (2 * math.sqrt(T))
                 + r * K * math.exp(-r * T) * norm_cdf(-d2))

    return {"price": price, "delta": delta, "gamma": gamma, "vega": vega, "theta": theta}


def iron_condor_fair_credit(S, T, r, sigma, long_put_k, short_put_k, short_call_k, long_call_k):
    """Net credit implied by Black-Scholes fair value — computed, not assumed."""
    lp = bs_greeks(S, long_put_k, T, r, sigma, "put")["price"]
    sp = bs_greeks(S, short_put_k, T, r, sigma, "put")["price"]
    sc = bs_greeks(S, short_call_k, T, r, sigma, "call")["price"]
    lc = bs_greeks(S, long_call_k, T, r, sigma, "call")["price"]
    return (sp - lp) + (sc - lc)


def iron_condor_payoff(S_exp, long_put_k, short_put_k, short_call_k, long_call_k, net_credit):
    """P&L per share at expiration."""
    long_put_val = max(long_put_k - S_exp, 0.0)
    short_put_val = max(short_put_k - S_exp, 0.0)
    short_call_val = max(S_exp - short_call_k, 0.0)
    long_call_val = max(S_exp - long_call_k, 0.0)
    return (long_put_val - short_put_val) + (long_call_val - short_call_val) + net_credit


def position_greeks(S, T, r, sigma, long_put_k, short_put_k, short_call_k, long_call_k):
    """Sum leg Greeks with position sign. Flat vol across strikes — a simplification;
    real markets show a volatility skew across strikes that this ignores."""
    legs = [
        (+1, bs_greeks(S, long_put_k, T, r, sigma, "put")),
        (-1, bs_greeks(S, short_put_k, T, r, sigma, "put")),
        (-1, bs_greeks(S, short_call_k, T, r, sigma, "call")),
        (+1, bs_greeks(S, long_call_k, T, r, sigma, "call")),
    ]
    totals = {"delta": 0.0, "gamma": 0.0, "vega": 0.0, "theta": 0.0}
    for sign, g in legs:
        for key in totals:
            totals[key] += sign * g[key]
    return totals
Running it with the same strikes used above (S=100, T=30/365, r=0, sigma=0.20):
Fair-value net credit = 1.0206

Max profit = 1.02, Max loss = -3.98
Breakevens = 93.98 / 106.02

Position Greeks (raw Black-Scholes units):
 delta = -0.0074
 gamma = -0.0645
  vega = -10.6084   (per 1.0 vol change — divide by 100 for per-vol-point)
 theta = +12.9069   (per year — divide by 365 for per-day)
Two conversions matter here and are a common source of confusion: Black-Scholes vega comes out per full unit of volatility (i.e., per 100 percentage points), and theta comes out per year. Neither is how a broker platform displays them. Divide vega by 100 to get the practitioner convention — dollars of P&L per 1-percentage-point move in implied vol — and divide theta by 365 to get dollars of decay per day. That's where the $0.11/share vega and $0.035/share/day theta quoted earlier come from. Getting this unit conversion wrong is a good way to misjudge a position's actual sensitivity by one or two orders of magnitude.
Three simplifications are baked into this code, and each one matters in a specific way rather than being a generic disclaimer: the risk-free rate is set to zero; volatility is held flat across all four strikes, when real markets price a skew (out-of-the-money puts typically trade at higher implied vol than at-the-money options, which shifts the actual vega and gamma distribution versus what's shown here, particularly on the put side); and there's no dividend yield term, which matters for dividend-paying equity underlyings — a short call on a stock going ex-dividend is where early-assignment risk concentrates, covered in the risks section below. A version of this meant for anything beyond illustration would need per-strike implied vols and a dividend yield input, not the flat, zero versions used here.
When the structure argues for itself, and when it argues against itself
An iron condor is not a strategy that "works" or "doesn't work" in the abstract — it's a bet on realized volatility coming in below what was priced into the credit, wrapped in a defined-risk structure. That framing tells you directly when it's structurally favorable and when it isn't:
It's structurally aligned with range-bound or mean-reverting conditions, where the underlying spends the position's life inside the profit zone and time decay does the work the trade is designed to collect.
It's structurally opposed to trending or breakout conditions, where a sustained directional move carries price through a breakeven and toward a long strike, and to volatility-expansion events, where the vega loss can outpace anything gamma or theta offset.
This isn't a matter of finding the right entry rules to fix — it's what a short-volatility, defined-risk structure is. No amount of strike selection changes the fact that the position is short gamma and short vega by construction. What strike selection changes is how much premium you collect for taking that exposure, and how far the underlying has to move before it hurts you.
Risks and limitations
- Gamma risk is concentrated, not constant. It's small and easy to ignore in the first half of a trade's life and largest right when it's hardest to manage — near expiration, near a short strike. Position sizing based on day-one Greeks will understate the risk the trade carries later.
- Assignment and settlement mechanics depend on the underlying. American-style single-stock options can be assigned early, most commonly on in-the-money calls just before an ex-dividend date. European-style, cash-settled index products remove early-assignment risk entirely, which is a meaningfully different operational profile — not just a technical footnote — for anyone running this systematically across many positions.
- Four legs mean four bid-ask spreads and four commissions. On a structure whose entire edge (if any) is a modest net credit, execution costs are not a rounding error — they can consume a large fraction of the theoretical edge, especially in less liquid names or wider markets.
- Any systematic rule layered on top is itself unproven until tested. "Sell the 16-delta strikes," "close at 50% of max credit" — these are common heuristics in options-selling communities, not backtested laws. Popularity is not evidence. If you adopt a rule like this, treat it as a hypothesis to validate against your own data and costs, not as an established edge.
- The payoff shape is structurally asymmetric in frequency and size. Selling premium tends to produce frequent small wins and infrequent larger losses. That shape can look like a high win rate over any sample that doesn't include a volatility event — and can look completely different the moment it does. A short sample of realized outcomes is weak evidence about the underlying distribution.
- Nothing here has been backtested. This article shows mechanics and analysis, not performance. Do not treat the payoff diagram or the Greek values as evidence that the strategy is profitable after costs — they show what the structure does, not whether it pays.
What traders often misunderstand
Defined risk is not the same as safe. Capping max loss bounds the size of a bad outcome; it says nothing about how often bad outcomes happen or how they cluster in time. A structure can be defined-risk and still lose money consistently after costs.
A wide profit zone is not the same as a high-probability trade in your favor. The width between breakevens tells you where you're flat or ahead at expiration — it doesn't tell you the actual probability of finishing there, which depends on the real-world distribution of the underlying, not just the strikes you chose.
Ignoring execution costs on a four-leg structure is one of the most common ways a theoretically sound idea underperforms in practice. A credit that looks reasonable on a mid-price quote can shrink substantially once you account for realistic fills on all four legs.
Trading without a predefined management rule is a decision, not a neutral default. Choosing to hold to expiration versus closing early at some threshold changes the position's realized gamma and vega exposure over its life. Not choosing is equivalent to choosing "hold to expiration and accept full gamma risk into the close" — that should be a deliberate choice, not an accident.
Practical takeaway
An iron condor is fully specified by four strikes and a credit: those numbers determine its max profit, max loss, breakevens, and its Greek exposures at any point in its life. That precision is useful — it means you can compute exactly what you're exposed to, rather than relying on a description of the strategy's "personality." What that precision does not give you is an edge. Whether selling this particular structure, at these particular strikes, at these particular costs, is worth doing is a separate question that requires evidence this article deliberately does not manufacture — real historical data, realistic execution assumptions, and enough sample size to distinguish a genuine edge from a favorable stretch of low volatility. Build the mechanics first. Test before you trust it.
This article is for educational purposes only and is not investment advice. Nothing here should be read as a recommendation to buy, sell, or hold any security or derivative.