
Why "Collecting Theta" Is the Wrong Way to Think About This Trade
Calendar spreads get taught as a theta-collection strategy: sell a near-term option, buy a longer-term option at the same strike, and let time decay do the work. That framing isn't wrong so much as it's aimed at the wrong mechanism. Theta is the symptom. What actually determines whether this position makes or loses money — its Greeks, its payoff shape, and the specific ways it fails — is the relative pricing of two different expirations' implied volatility: the term structure.
This matters because "collect theta" tells you nothing about when the trade is attractive and when it isn't. Term structure does. A calendar spread is a bet that the front-month and back-month implied vols you paid will move — individually or relative to each other — in a direction that favors the position, not a passive bet that time will pass. This piece treats it that way from here on: it builds the position from its two legs, derives its Greeks and payoff shape in tested code, and spends real space on the specific way this setup gets misused around earnings, because that's one of the more costly ways "collecting theta" thinking goes wrong.
Two Legs, One Strike, Two Expirations: What a Calendar Spread Actually Is
A calendar spread — also called a horizontal spread — is two options, same underlying, same strike, same type (both calls or both puts), different expirations:
- Sell the near-term option (the front leg).
- Buy the longer-dated option (the back leg).
That's it: two legs, one strike, two expirations. Opening it costs a net debit under normal (contango) term-structure conditions, because the longer-dated option is worth more than the shorter-dated one at the same strike — more time to expiration means more time value, and, as this article is largely about, usually a different implied volatility as well. That "usually" is doing real work: the term-structure section below shows a case where the relationship inverts entirely, and the position pays you to open it instead.
If you've read this blog's iron condor piece, the contrast is worth stating directly rather than assuming it: that structure was four legs, one shared expiration, and a net credit. This one is two legs, two expirations, and a net debit. If your mental model of "an options strategy" is "sell premium, collect a credit," a calendar spread doesn't fit it, and treating it like it does is a fast way to misjudge the trade.
The two-expiration structure has a direct consequence for how you have to price it: one flat volatility isn't enough. The iron condor could reasonably use a single shared implied vol across four strikes at one expiration — a real simplification, flagged as one in that piece, but not one that broke the example. A calendar spread priced with the same volatility for both legs has no term-structure differential at all — the entire subject of this article would vanish from its own worked example. Every number below uses two separate volatilities for exactly that reason.
The Payoff Isn't Flat, and It Isn't Final
Two things make a calendar spread's "payoff" a different kind of object than the iron condor's.
First, shape. The iron condor's profit zone between its short strikes is flat — anywhere in that range pays the same net credit at expiration, because at expiration every leg is either worthless or intrinsic and the whole position resolves to one number per outcome. A calendar spread doesn't have an expiration in that sense until its own legs both expire, and its back leg outlives its front leg by construction. So the relevant snapshot isn't "value at expiration" — it's value at some point before the front leg expires, and at that point the position is holding a mix of nearly-decayed front-leg time value and still-live back-leg time value. That mix is maximized when the underlying sits at the strike and decays as price moves away in either direction: a peak, not a plateau.
Second, and more consequential: front-month expiration doesn't end the trade. When the front leg expires, you're left holding a naked long back-month option — a real, separate position with its own delta, gamma, vega, and theta, and no partner leg offsetting it anymore. Deciding what to do with it — close it, hold it, roll into a new calendar by selling a new front-month leg against it — is a second, separate decision with its own risk, not an afterthought to the first trade.
The chart below makes the shape concrete: the calendar spread's value one day before front-leg expiration (back leg still has 31 days left), computed from the same model used throughout this article, plotted against where the underlying happens to be sitting at that moment.
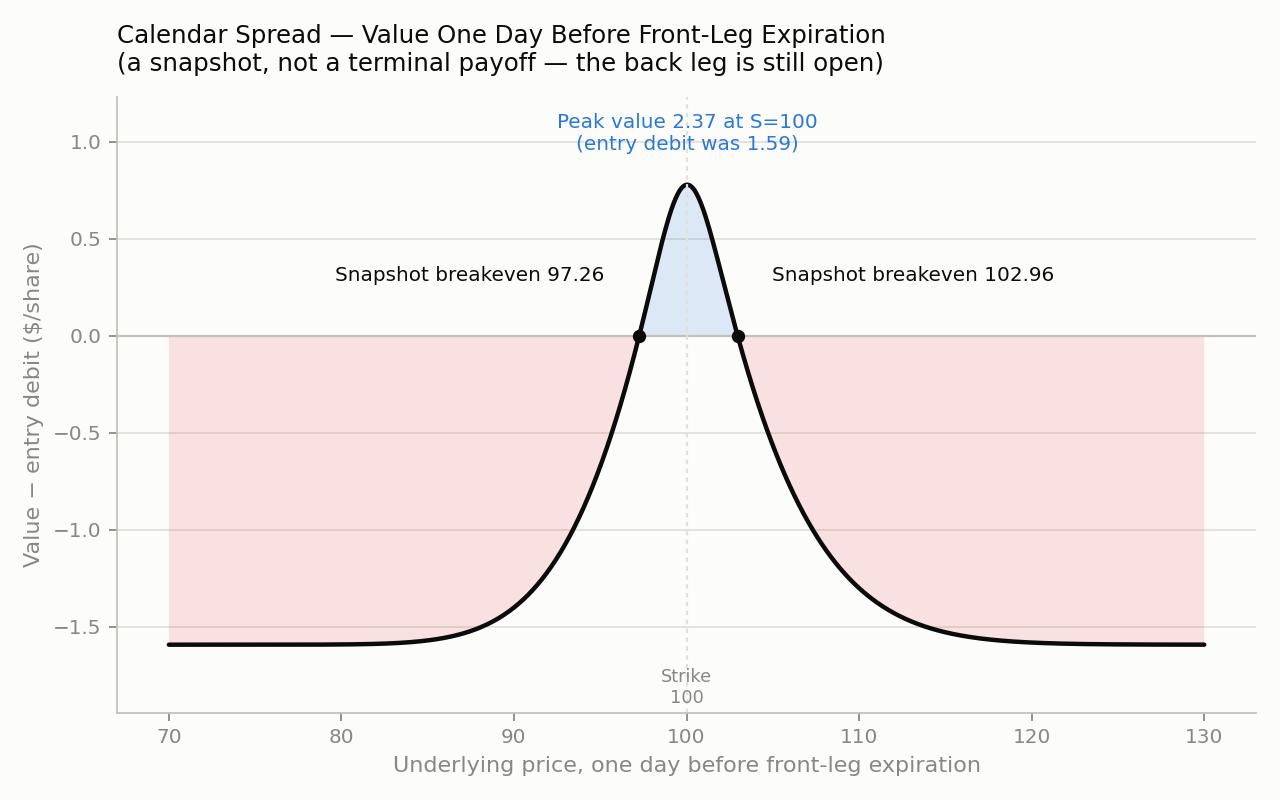 Calendar spread value one day before front-leg expiration — a peak at the strike, declining on both sides, with a narrow band where the position is ahead of its entry debit.
At the strike, value is highest — about $2.37/share against a $1.59/share entry debit (Case 1 in the worked implementation below), a gain of roughly $0.78/share if the underlying is sitting exactly on the strike one day before front expiration. Move ten points either way and that value collapses to a small fraction of a dollar — the position is worth roughly $0.29/share at 110, and $0.19/share at 90, both well below the entry debit. The "break-even" band at this snapshot — where value has recovered to at least the entry debit — runs from about 97.3 to 103.0: roughly three points either side of the strike, on a $100 underlying. That's narrow next to the iron condor's flat profit zone — though the comparison is rougher than it looks and shouldn't be read as more than a sense of scale: the iron condor's zone is a chosen-width, flat, terminal plateau, while this band is an emergent, curved, mid-life snapshot that merely crosses zero at those two points, not a plateau at all. The position rewards the underlying being close to the strike at a specific point in time; nearly everywhere else, most of the debit is at risk.
One clarification on what this chart is not: it is not a terminal payoff. Nothing here is resolved. The back leg is a live option with 31 days left, still subject to whatever happens to the underlying and to implied vol between this snapshot and its own expiration. Read it as "where things stand one day before you have to make the front-expiration decision," not as "how the trade ends."
Long Vega: The Opposite Bet From the Iron Condor
At initiation — before any time passes, both legs freshly priced — the position's Greeks (computed in the worked implementation below, using a 20% front-month vol and a 24% back-month vol, a mild, normal-shaped term structure) come out to:
- Delta ≈ +0.008 (per share) — close to flat. A symmetric at-the-money calendar carries no real directional view.
- Vega ≈ +$0.047/share per 1-point rise in implied volatility (≈ +$4.72/contract) — positive. The longer-dated leg carries more vega than the shorter-dated leg at the same strike, and you're long the longer-dated leg.
- Theta ≈ +$0.0058/share per day near the strike (≈ +$0.58/contract/day) — positive, for now: the front leg (short) loses time value faster in magnitude than the back leg (long) gains it back, so decay helps the position while the underlying sits near the strike. That's a near-the-strike, initiation-time statement, not a promise that holds everywhere — it's exactly the kind of number the chart above shows changing sharply as price moves away.
- Gamma ≈ −0.029 (per share) — negative.
That last one is worth stopping on. Long vega and short gamma is not the pairing intuition suggests. A reader's first guess is often "I'm net long an option here — the debit, the longer-dated leg — so I should be long gamma too," and that guess is wrong, because gamma is concentrated in the shorter-dated option, not the longer-dated one (gamma scales roughly with 1/√T, so the near-dated leg carries more of it per unit), and you're short that leg. The result is a position that benefits from rising implied volatility (long vega) while simultaneously being hurt by large, fast moves in the underlying (short gamma) — two exposures that would normally point the same direction in a single-leg position, pulling in different directions here because the position spans two different expirations.
If you've read the iron condor piece, here's the direct comparison: that structure was short vega and short gamma — a pure short-volatility bet with a defined-risk wrapper. This one is long vega and short gamma — it wants implied volatility to rise, but it does not want the underlying to move far or fast to get there. Those are two different, partially conflicting wants, and a large realized move (the thing gamma punishes) often happens alongside a spike in implied vol (the thing vega rewards) — which is exactly why "long vega" does not simply mean "this trade is happy when things get volatile." The next section is about why that distinction matters most around a specific, common source of exactly this conflict: earnings.
Term Structure: What You're Actually Trading, and the Earnings Trap
"Term structure" just means implied volatility is not one number for a given underlying — it's a curve across expirations. Two shapes matter here.
Contango — back-month IV higher than front-month IV — is the normal, more common shape. It roughly reflects a term premium for the added uncertainty of a more distant, harder-to-forecast future, combined with a tendency for near-term vol to mean-revert toward a longer-run average rather than staying wherever it happens to be today. The worked example in this article so far (20% front, 24% back) is a contango example.
Backwardation — front-month IV higher than back-month IV — is the less common shape, and it concentrates around known near-term events: earnings, an FDA decision, a court ruling, anything with a scheduled date and a binary-ish outcome. Uncertainty about the days immediately around that date gets priced into the front-month option specifically, pushing its IV above the back month's.
This is where the classic, commonly mistaught calendar spread setup lives: sell an earnings calendar because the front-month IV "looks rich" relative to the back month. The reasoning sounds like an edge — you're selling the expensive one and buying the cheap one — and it is exactly the trap this piece is trying to warn against. Elevated front IV ahead of a known event is, most of the time, the market pricing in the real possibility of a large move on that date, not a mispricing waiting to be collected. Backwardation by itself is not evidence of edge. It's evidence that the market expects the near term to be more eventful than the medium term, which is often simply true.
The numbers make this concrete rather than just asserted. Repricing the exact same structure — same strike, same spot, same 30/60-day expirations — under a constructed backwardation scenario (35% front IV, 22% back IV, front IV now well above back IV instead of below it; these specific levels are chosen to illustrate the mechanism clearly, not observed on any real name or event) against the original contango case:
| Front IV | Back IV | Net premium | Gamma at initiation | |
|---|---|---|---|---|
| Case 1 — contango (normal) | 20% | 24% | $1.59/share debit | −0.029 |
| Case 2 — backwardation (pre-event) | 35% | 22% | $0.44/share credit | +0.005 |
Two things change, and both are worth sitting with rather than skimming past. The position flips from costing $1.59/share to open to paying you $0.44/share to open it, on the model's mid-prices — selling the rich front leg now more than covers buying the cheaper back leg. That's the "getting paid to make this bet" feeling that makes the earnings-calendar setup look attractive, and it's worth being precise about what "paying you" means here: a mid-price credit, before the wider bid-ask this setup typically involves (see Risks, below) has had any chance to eat into it. Gamma flips sign too, from negative to slightly positive, because gamma is inversely related to volatility in the Black-Scholes formula — a much higher front-month vol actually reduces the front leg's gamma contribution, enough here to flip the net. Theta gets larger, too — +13.51/year raw versus Case 1's +2.12/year — because the front leg, now carrying a much higher IV, decays even faster in magnitude while you're short it: one more number that can make this setup look attractive in the moment. Vega, notably, stays positive in this example (+$0.047/share per vol-point, essentially unchanged) — its sign is driven mainly by the back leg's larger √T weighting, which a front-IV spike of this size doesn't overcome. That's a property of this parameter range, not a law; a large enough front-IV spike can still flip vega too, and it should be checked numerically for any specific case rather than assumed.
None of that means "the trade doesn't work." It means being paid to open a position is not the same as the position being safe. The credit you'd collect in Case 2 is compensation for a real, specific risk: if the underlying gaps through the strike around the event — exactly the scenario the elevated front IV was pricing in — the position still loses most of its value the same way it does in the chart above, by moving away from a narrow peak, regardless of which way gamma happens to point at initiation (+0.005 is a sign flip, not a meaningful amount of convexity protection). On top of that, there's a second way to lose: if implied vol collapses unevenly across the two legs once the event passes and the uncertainty resolves — which is the normal post-event pattern — the term-structure bet itself can go the wrong way too. "Front IV is elevated" is a fact about pricing. Whether it's also mispriced — richer than the real distribution of outcomes justifies — is a separate empirical question this article cannot answer with a Black-Scholes example and does not claim to.
Worked Implementation: Pricing and Greeks Across Two Expirations
Every number in this article so far was computed, not hand-picked, by the small Black-Scholes implementation shown here in full. It builds in three layers: a single-leg option pricer with its Greeks (identical in method to the iron condor piece's — this piece's extension is in how it's called, not in the pricing formula itself); a two-expiration net-debit function that prices the front and back legs separately and subtracts; and position Greeks, summed leg by leg with sign (−1 for the short front leg, +1 for the long back leg). Two more functions reprice the position at a later, different pair of remaining times-to-expiry — producing the value-vs-spot snapshot used in the chart above — and locate where that snapshot value crosses the entry debit. This is structural and mechanics analysis on synthetic inputs: no historical data, no backtest, no performance claim, the same discipline the iron condor piece used.
import math


def norm_cdf(x):
    return 0.5 * (1.0 + math.erf(x / math.sqrt(2.0)))


def norm_pdf(x):
    return math.exp(-0.5 * x * x) / math.sqrt(2.0 * math.pi)


def bs_greeks(S, K, T, r, sigma, option_type):
    """Black-Scholes price and Greeks for a single European option leg.
    No dividend yield term (q=0) — immaterial to this article's subject."""
    if T <= 0 or sigma <= 0:
        raise ValueError("T and sigma must be > 0 — d1/d2 are undefined at the boundary.")
    d1 = (math.log(S / K) + (r + 0.5 * sigma ** 2) * T) / (sigma * math.sqrt(T))
    d2 = d1 - sigma * math.sqrt(T)

    gamma = norm_pdf(d1) / (S * sigma * math.sqrt(T))
    vega = S * norm_pdf(d1) * math.sqrt(T)  # per 1.0 (100-point) vol change

    if option_type == "call":
        price = S * norm_cdf(d1) - K * math.exp(-r * T) * norm_cdf(d2)
        delta = norm_cdf(d1)
        theta = (-(S * norm_pdf(d1) * sigma) / (2 * math.sqrt(T))
                 - r * K * math.exp(-r * T) * norm_cdf(d2))
    else:  # put
        price = K * math.exp(-r * T) * norm_cdf(-d2) - S * norm_cdf(-d1)
        delta = norm_cdf(d1) - 1.0
        theta = (-(S * norm_pdf(d1) * sigma) / (2 * math.sqrt(T))
                 + r * K * math.exp(-r * T) * norm_cdf(-d2))

    return {"price": price, "delta": delta, "gamma": gamma, "vega": vega, "theta": theta}


def calendar_spread_fair_debit(S, K, T_front, T_back, r, sigma_front, sigma_back, option_type="call"):
    """Net debit implied by fair value: long back leg minus short front leg.
    Computed, not assumed — and it can go negative (a net credit) under strong
    backwardation, which is the point of the earnings-trap section above."""
    front = bs_greeks(S, K, T_front, r, sigma_front, option_type)["price"]
    back = bs_greeks(S, K, T_back, r, sigma_back, option_type)["price"]
    return back - front


def calendar_spread_position_greeks(S, K, T_front, T_back, r, sigma_front, sigma_back, option_type="call"):
    """Sum leg Greeks with position sign: -1 short front, +1 long back."""
    front = bs_greeks(S, K, T_front, r, sigma_front, option_type)
    back = bs_greeks(S, K, T_back, r, sigma_back, option_type)
    return {k: -front[k] + back[k] for k in ("delta", "gamma", "vega", "theta")}


def calendar_spread_value(S, K, T_front_remaining, T_back_remaining, r, sigma_front, sigma_back, option_type="call"):
    """Position value at a later point in time, given each leg's REMAINING time to
    its own expiry. A mark-to-model snapshot, not a terminal payoff — the back leg
    is still a live option being priced by the model, not settled to intrinsic value."""
    front = bs_greeks(S, K, T_front_remaining, r, sigma_front, option_type)["price"]
    back = bs_greeks(S, K, T_back_remaining, r, sigma_back, option_type)["price"]
    return back - front


def find_snapshot_breakevens(K, T_front_remaining, T_back_remaining, r, sigma_front, sigma_back,
                              entry_debit, option_type="call", lo=50.0, hi=150.0, steps=20000):
    """Scan for sign changes of (value - entry_debit) and bisect each crossing.
    These are snapshot breakevens at one point in time, not final breakevens —
    the position is still open and can move after this point."""
    xs = [lo + (hi - lo) * i / steps for i in range(steps + 1)]

    def f(S):
        return calendar_spread_value(S, K, T_front_remaining, T_back_remaining, r,
                                      sigma_front, sigma_back, option_type) - entry_debit

    crossings = []
    prev_x, prev_f = xs[0], f(xs[0])
    for x in xs[1:]:
        fx = f(x)
        if (prev_f < 0) != (fx < 0):
            a, b, fa = prev_x, x, prev_f
            for _ in range(60):
                mid = (a + b) / 2
                fm = f(mid)
                if (fa < 0) == (fm < 0):
                    a, fa = mid, fm
                else:
                    b = mid
            crossings.append((a + b) / 2)
        prev_x, prev_f = x, fx
    return crossings
Running it with S=100, K=100, T_front=30/365, T_back=60/365, r=0:
Case 1 — contango (20% front IV, 24% back IV):
  Net debit                 = 1.5933
  Position delta            = +0.0080
  Position gamma            = -0.0286
  Position vega  (raw)      = +4.7231   (per vol-point: +0.0472)
  Position theta (raw/year) = +2.1160   (per day: +0.0058)

  Value one day before front expiry, at the strike (S=100): 2.3721
  Snapshot breakevens (value == entry debit): 97.26 / 102.96

Case 2 — backwardation (35% front IV, 22% back IV):
  Net debit      = -0.4441   (a net credit)
  Position delta = -0.0022
  Position gamma = +0.0050
  Position vega  = +4.7358
  Position theta = +13.5084   (raw/year — larger than Case 1's +2.1160)
Same two unit conversions as the iron condor piece, because they're properties of the Black-Scholes formula, not of this specific structure: raw vega comes out per full 1.0 (100-point) move in volatility, so divide by 100 for the practitioner convention of dollars per 1-point IV move; raw theta comes out per year, so divide by 365 for dollars per day. Both conversions are already applied in the Greek values quoted earlier in this article.
Three simplifications are doing real work in this code, same discipline as before. r is set to zero. Volatility is flat within each expiration — no smile as the underlying's moneyness relative to the fixed strike changes (notice sigma_front/sigma_back stay constant across the entire spot range in the chart above) — which is the axis this piece deliberately ignores, since its subject is the term-structure axis (across expirations) instead. And there's no dividend yield term at all, which is fine here — unlike the iron condor piece, where that was a stated simplification with real consequences, this piece's subject genuinely doesn't depend on dividends. (It uses calls throughout; at this at-the-money strike, with no dividend, put-call parity means puts price identically, so the choice doesn't matter for this example — a direct consequence of parity at S=K, not a coincidence, though the code above doesn't spell that check out since it's not this piece's subject. That stops being true the moment a dividend enters the picture, which is left for a separate piece on this blog.) The bigger simplification is European-style pricing for what are, in practice, American-style equity options — which is exactly why assignment risk gets its own point in the risks section next, rather than being waved off as a technicality.
Where This Trade Actually Goes Wrong
- Pin risk. The chart above says this plainly: the position's best outcome requires the underlying to be close to the strike at a specific point in time, and value collapses quickly moving away from the strike in either direction. A calendar spread is not a "wide profit zone" trade the way a strangle-derived structure can be — its favorable region is narrow by construction.
- Gap and event risk. A large, fast move through the strike — the exact scenario an elevated front IV is often pricing in — can erode most of the entry debit quickly, before the back leg's remaining time value has a chance to offset it. This is the mechanical form of the earnings trap from the section above.
- Assignment risk on the short front leg. Real US equity options are American-style; this article's pricing model is European. The specific place that gap matters most: an in-the-money short call can be assigned early, most commonly right before an ex-dividend date, as the counterparty exercises to capture the dividend. Early assignment on the front leg turns a two-leg position into a one-leg position — a naked long back-month option, potentially paired with stock from the assignment — earlier and less predictably than planned. Dividend-paying underlyings carry this risk in a way index or non-dividend names don't.
- The post-front-expiration decision is a second risk-bearing choice, not an afterthought. Once the front leg expires or is closed, the trader holds a naked long option with its own delta, gamma, vega, and theta. Closing it, holding it, or rolling into a new front-month short leg are three different decisions with three different risk profiles — none of them is "the trade automatically continuing."
- Term-structure estimation risk. This trade's economics depend on the relative pricing of two different implied vols, which is a harder estimation problem than a single-expiry vol view. Getting the front leg's IV roughly right but the back leg's IV wrong — or vice versa — changes the position's actual exposure in ways a single-number "IV was high or low" post-mortem won't capture.
- Execution costs, and specifically back-month liquidity. Two legs at two different expirations means two separate bid-ask spreads, and they are usually not equally tight: back-month contracts, especially beyond the front one or two expiration cycles, typically trade in wider, thinner markets than the front month. Every number in this article is computed at the model's mid-price — not what you would actually pay or receive. On a position this size (low single-digit dollars per share), realistic execution costs on the wider leg can consume a meaningful fraction of the entire economics; they are not a rounding error, and they matter more here than in the iron condor's four-legs-one-expiration case, where all four legs at least share comparable liquidity.
What Traders Often Get Wrong About Calendars
"Long vega" does not mean "this trade likes higher volatility." Vega sign describes sensitivity to a small, parallel move in both legs' implied vol. Real-world vol changes are rarely a clean parallel shift — an event typically moves front-month IV much more than back-month IV, which is a non-parallel shift, and Case 2 above shows exactly how differently the position can behave once the term structure itself changes shape rather than sliding up or down together.
Elevated front IV is a fact about price, not evidence of edge. Treating "front month looks rich relative to back month" as a signal to sell, on its own, skips the actual question: is that richness fair compensation for real event risk, or is it mispriced? Backwardation answers "is the front expensive relative to the back," not "is the front expensive relative to what's actually going to happen."
The trade is not finished at front expiration. A trader who treats front-month expiry as the end of the position — the way it genuinely is the end for a single-expiration structure like the iron condor — walks into a naked, un-managed back-month option by default. Not deciding what to do with it is itself a decision, and usually not a deliberate one.
Practical Takeaway
A calendar spread is fully specified by two expirations, one strike, and the implied vols priced into each leg — which is enough to compute its debit, its Greeks at any point before front expiration, and the shape of its value as the underlying moves. That's useful: it means you can know exactly what you're holding instead of relying on a slogan about theta. It is not, by itself, an edge. Whether selling the front month against a long back month is worth doing — at real bid-ask costs on two separate expirations, under real term-structure conditions, with a real view on whether any given backwardation is mispriced or simply correct — is a separate, empirical question this article has deliberately not tried to answer. Build the mechanics first. Test the specific setup, especially around events, before you trust it.
This article is for educational purposes only and is not investment advice. Nothing here should be read as a recommendation to buy, sell, or hold any security or derivative.